|
|
|
|
DEVELOPMENT OF AN ACCIDENT PREDICTOR INTERFACE FOR PREDICTING ACCIDENT POTENTIALS OF TRANSPORT VEHICLES IN NIGERIA
Chukwunonso Nweze Nwogu 1![]()
![]() ,
Ama Agwu Anya 2
,
Ama Agwu Anya 2![]()
![]() , Bethrand
Nduka Nwankwojike 3
, Bethrand
Nduka Nwankwojike 3![]()
![]()
1 Senior
Lecturer, Department of Mechanical Engineering, Michael Okpara University of Agriculture,
Umudike, Abia State, Nigeria
2 Master’s
Student, Department of Mechanical Engineering, Michael Okpara University of Agriculture,
Umudike, Abia State, Nigeria
3 Professor, Department of Mechanical Engineering, Michael Okpara
University of Agriculture, Umudike, Abia State,
Nigeria
|
|
|
ABSTRACT |
|
|
In this work,
an accident prediction model was developed for determining the accident
potential of a vehicle while on transit. The developed model identifies Human
factors (HF), Mechanical factors (MF) and Environmental factors (EF) as the
main factors responsible for vehicle crashes. The accident data used for this
research was obtained from the Nigerian Federal Road Safety Corps (FRSC).
Analysis of the accident data showed that HF contributes 0.846 accident
probability, MF contributes 0.138 accident probability while EF contributes
0.016 accident probability. Also, driver’s age, distance of travel and
maintenance frequency of the vehicle were considered in the development of
the model, since they also play significant roles in determining accident
probabilities. The model gives results ranging from 0-1. When the value is
close to 0, it signifies low accident probability while values close to 1
signify high accident probability. An accident predictor interface was
developed by combining all the possible accident cause factors. The accident
predictor interface gave the least accident probability value of 0.2892 for
the following combination: driver age of 60+ years, regular maintenance
frequency and travel distance of C ≤ 250 Km. Application of the results
of this model will significantly reduce the rate of road accident
occurrences. Finally, transport companies and fleet owners are encouraged to
embrace and use this innovation for safer operations. |
|||
|
Received 20 July 2024 Accepted 28 August 2024 Published 05 October 2024 Corresponding Author Chukwunonso
Nweze Nwogu, checknolly@yahoo.com DOI 10.29121/ShodhAI.v1.i1.2024.15 Funding: This research
received no specific grant from any funding agency in the public, commercial,
or not-for-profit sectors. Copyright: © 2024 The
Author(s). This work is licensed under a Creative Commons
Attribution 4.0 International License. With the
license CC-BY, authors retain the copyright, allowing anyone to download,
reuse, re-print, modify, distribute, and/or copy their contribution. The work
must be properly attributed to its author.
|
|||
|
Keywords: Accident, Accident Potential, Accident Data, Vehicle
Crash, Accident Prediction |
|||
1. INTRODUCTION
Road transport remains the chief universal means of transportation in Nigeria in comparison to air, rail, and water transport. Recent advances in technological development have resulted in the possible evolution of different types and models of modern and aesthetic vehicles with greater comfort and maneuverability; in contrast to the pre-colonial means of transportation such as the use of animals Gupta et al. (2009) The influx of these vehicles and the expansion of fleet operators in Nigerian have crowded the Nigerian motoring environment, thereby making road traffic a major challenge to combat in the country Oyedepo, O. J. (2010)These road traffic challenges in Nigeria often result in road traffic accidents, most times, with its attendant carnages. In the recent time, road traffic accident tolls have been on the increase in Nigeria. Several factors are responsible for this; they range from the drivers’ attitude to the deplorable road network. The Nigerian roads have become death traps, with no protection for the users Oyedepo, O. J. (2010) Travelers are often faced with the uncertainty of whether they would be able to reach their destinations and so become apprehensive of the journeys they make. This bothersome trend has great unfavorable effects on the nation's health system as well as her social and economic endeavors.
The ease in movement of human and items, notwithstanding, so many families have been bereaved of their breadwinners and loved ones by the menace of road traffic accidents in Nigeria. As reported by the FRSC, over 88,520 road users lost their lives between the years 1991 and 2000 alone, most of the victims were below 40 years of age FRSC et al. (2006) Between the year 2012 and 2016 alone, about 57,894 road traffic accidents were recorded. Such factors as environmental, mechanical, human factors, etc. were responsible for the accidents FRSC, (2016)Considering the precarious nature of the Nigerian roads, the poor maintenance culture of most transport vehicle owners and the unwholesome attitude of most drivers, there is a dire need to treat road accident as a major issue that requires urgent attention in order to prevent untimely deaths; reduce health risks, social and economic impacts it poses on the Nigerian road users in particular and the society at large.
Over 50 percent of the aggregate global road traffic deaths involve persons of ages 15 to 44; in their key productive years. Furthermore, the disability load for this age group records about 60.0 percent of all disability-life years Beirness et al. (2011). The consequences and costs of these losses are momentous. About 3/4 of the total deprived families who lost their loved ones in a traffic crash reported a decline in their livelihood, and about 61.0 percent reported that they had resorted to borrowing money for their daily expenses, consequent upon their loss Beirness et al. (2011). The World Bank report estimated that road traffic injuries cost between 2 percent to 3 per cent of the GDP of developing countries, or twice the total development aid given worldwide to developing countries World bank (2015). Though transport agencies often try to identify the most hazardous road spot, and put enormous efforts into protective measures, the yearly traffic crash toll has not hitherto been appreciably reduced World bank (2015).
Road crash, prediction models are crucial tools in highway safety, considering its ability to determine both the crash frequency and the degree of severity of crash. Measures for useful interventions to trim down crash toll include design of safer road infrastructure and integration of road safety elements into land use and transport planning; upgrading of vehicle safety attributes; advancement of post-crash care for victims of road traffic crashes; and enhancement of driver behavior as well as raising public consciousness. About 35,092 road traffic fatalities were documented in the US in 2015, an increase of 7.2% compared to the preceding year. It is in consideration of these trend that the research is targeted at developing a model that could predict the probability of a transport vehicle to have accident while on transit. This prediction model would be used by transport agencies/fleet owners to increase knowledge of the safety of their vehicles.
2. METHODOLOGY
The study involves the use of road traffic accident data sourced from the robust database of the FRSC, a federal government agency saddled with the responsibility of managing road traffic in Nigeria, to develop an accident prediction model. Twenty accident cause-factors were considered responsible for the various road traffic accidents that occurred throughout the country during the period. The collected accident data covered a period of five years from 2012 to 2016 of accident occurrence Table 1. The accident data was analysed to reflect the various accident-cause factors and their various probabilities. The data was then used to derive the respective accident occurrence probabilities for each of the accident-cause factors.
Table 1
|
Table 1 Road Traffic Accident Causes in Nigeria from 2012 to 2016 |
||||||
|
S/N |
Road Traffic Accident
(RTA) CAUSES |
2012 |
2013 |
2014 |
2015 |
2016 |
|
1. |
Speed
violation (SPV) |
2374 |
5495 |
3496 |
3195 |
3848 |
|
2. |
Loss of control
(LOC) |
1183 |
2928 |
2445 |
2770 |
1753 |
|
3. |
Dangerous
Driving (DGD) |
1096 |
2082 |
1324 |
1137 |
969 |
|
4. |
Wrong Overtaking (WOT) |
270 |
623 |
147 |
546 |
832 |
|
5. |
Sign/Light
Violation (SLV) |
3 |
333 |
905 |
1097 |
736 |
|
6. |
Tyre Burst (TBT) |
623 |
1271 |
873 |
813 |
689 |
|
7. |
Route
Violation (RTV) |
165 |
582 |
513 |
524 |
591 |
|
8. |
Brake Failure (BFL) |
344 |
584 |
418 |
479 |
567 |
|
9. |
Mechanically
Deficient Vehicle (MDV) |
158 |
450 |
226 |
197 |
316 |
|
10. |
Others, Unidentified
causes (OTH) |
0 |
228 |
175 |
262 |
246 |
|
11. |
Road
Obstruction Violation (OBS) |
116 |
85 |
181 |
167 |
182 |
|
12. |
Dangerous Overtaking (DOT) |
106 |
591 |
261 |
216 |
144 |
|
13. |
Overloading
(OVL) |
46 |
165 |
114 |
82 |
99 |
|
14. |
Sleeping on Steering (SOS) |
36 |
207 |
48 |
55 |
78 |
|
15. |
Fatigue
(FTQ) |
5 |
263 |
61 |
85 |
73 |
|
16. |
Driving Under
Alcohol/Drug (DAD) |
36 |
179 |
93 |
63 |
57 |
|
17. |
Use
of Phone While Driving (UPD) |
26 |
77 |
32 |
38 |
32 |
|
18. |
Night Journey (NJR) |
13 |
15 |
20 |
14 |
11 |
|
19. |
Poor
Weather, (PWR) |
4 |
40 |
28 |
16 |
27 |
|
20. |
Bad Road (BRD) |
139 |
295 |
101 |
67 |
124 |
|
Source FRSC, 2016 |
||||||
Road Traffic Accident Causes in Nigeria from 2012 to 2016
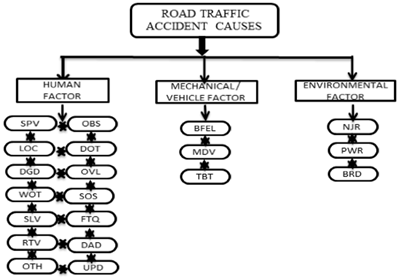
The twenty accident-cause-factors presented in Table 1 were further classified into the three-chief accident-cause factors: Human factors HF, Mechanical factors MF and Environmental factors EF. With the above classification, an accident flow-diagram is developed and presented in Figure 1.
Figure 1
|
Figure 1 Flow-Diagram Showing the Causes
of Road Transport Accident |
Figure 1 shows the summarized accident-cause factors responsible for accident occurrences during the five-year period. The accident flowchart makes it easier to appreciate the accident-cause factors at a glance.
Based on data from Abdulhafedh, A. (2017), Kalyoncuoğlu et al. (2014), Hermitte, T. (2012)., Oyetunji et al. (2017), and interactions with fleet operators and transport company workers, the age group of the driver Ai, maintenance frequency of the vehicle Bj and the distance of travel Ck were used as chief accident predictors. The various accident predictive factors (Ai, Bj and Ck) were scored based on their individual accident-cause load (the susceptibility to accident cause). These scores were utilized in computing the fractional scores. Table 2 shows the analysis of the accident predictive factors point scores as well as their respective fractional scores (Ҳi,j,k).. These fractional scores are integrated into the model for accident prediction.
Table 2
|
Table 2 Analysis of the
Accident Predictive Factors |
|||||
|
Age of the Driver (Ai) |
|||||
|
Class |
Score |
Fractional
Score, Ҳi |
|||
|
Group A1 |
18-38 |
3 |
0.423 |
||
|
Group
A2 |
39-59 |
2 |
0.282 |
||
|
Group A3 |
60+ |
1 |
0.141 |
||
|
Ҳi= (score Ai÷ ∑score Ai)
*0.846 |
|||||
|
Maintenance Frequency
(Bj) |
|||||
|
Class |
Score |
Fractional
Score, Ҳj |
|||
|
Group B1 |
Regular |
1 |
0.023 |
||
|
Group
B2 |
Irregular |
2 |
0.046 |
||
|
Group B3 |
Reactive |
3 |
0.069 |
||
|
Ҳj= (score Bj÷
∑score Bj) *0.138 |
|||||
|
Distance
of Travel (Ck) |
|||||
|
Class |
Score |
Fractional
Score, Ҳk |
|||
|
Group C1 |
C≤ 250 KM |
1 |
0.0027 |
||
|
Group
C2 |
250
≤C≤ 500 KM |
2 |
0.0053 |
||
|
Group C3 |
C≥ 500 KM |
3 |
0.008 |
||
|
Ҳk= (score Ck÷∑score Ck)
*0.016 |
|||||
In the development of the desired accident prediction model, the accident data Table 1was further manipulated to obtain the respective accident-cause fractions (probabilities, Pr) which form the basis for the model development. The various accident-cause factors and their respective probabilities are presented in Table 3.
Table 3
|
Table 3 RTA-Cause Factors and
their Probabilities |
||||||||
|
S/N |
CAUSES OF |
2012 |
2013 |
2014 |
2015 |
2016 |
TOTAL |
Pr. |
|
|
RTA |
|
|
|
|
|
|
|
|
1. |
SPV |
2374 |
5495 |
3496 |
3195 |
3848 |
18408 |
0.318 |
|
2. |
LOC |
1183 |
2928 |
2445 |
2770 |
1753 |
11079 |
0.191 |
|
3. |
DGD |
1096 |
2082 |
1324 |
1137 |
969 |
6608 |
0.114 |
|
4. |
WOT |
270 |
623 |
147 |
546 |
832 |
2418 |
0.042 |
|
5. |
SLV |
3 |
333 |
905 |
1097 |
736 |
3074 |
0.053 |
|
6. |
TBT |
623 |
1271 |
873 |
813 |
689 |
4269 |
0.074 |
|
7. |
RTV |
165 |
582 |
513 |
524 |
591 |
2375 |
0.041 |
|
8. |
BFL |
344 |
584 |
418 |
479 |
567 |
2392 |
0.041 |
|
9. |
MDV |
158 |
450 |
226 |
197 |
316 |
1347 |
0.023 |
|
10. |
OTH |
0 |
228 |
175 |
262 |
246 |
911 |
0.016 |
|
11. |
OBS |
116 |
85 |
181 |
167 |
182 |
731 |
0.013 |
|
12. |
DOT |
106 |
591 |
261 |
216 |
144 |
1318 |
0.023 |
|
13. |
OVL |
46 |
165 |
114 |
82 |
99 |
506 |
0.009 |
|
14. |
SOS |
36 |
207 |
48 |
55 |
78 |
424 |
0.007 |
|
15. |
FTQ |
5 |
263 |
61 |
85 |
73 |
487 |
0.008 |
|
16. |
DAD |
36 |
179 |
93 |
63 |
57 |
428 |
0.007 |
|
17. |
UPD |
26 |
77 |
32 |
38 |
32 |
205 |
0.004 |
|
18. |
NJR |
13 |
15 |
20 |
14 |
11 |
73 |
0.001 |
|
19. |
PWR |
4 |
40 |
28 |
16 |
27 |
115 |
0.002 |
|
20. |
BRD |
139 |
295 |
101 |
67 |
124 |
726 |
0.013 |
|
|
TOTAL |
6743 |
16493 |
11461 |
11823 |
11374 |
57894 |
1 |
The accident occurrence probability (Pr) for each accident-cause factor, is the ratio of the total accident caused by a particular factor to the cumulative accident occurrence over the entire five-year period. Pr is therefore the quotient of ‘row total’ (rt) and the ‘column total’, (ct) as shown in Table 3.
Pr for the three main accident cause factors as classified in Figure 1was also computed from Table 3 and the results shown in Table 4.
Table 4
|
Table 4 RTA-Causes and Probabilities by three Main Accident
Factors |
|||||||
|
2012 |
2013 |
2014 |
2015 |
2016 |
Total |
Pr. |
|
|
HF |
5462 |
13838 |
9795 |
10237 |
9640 |
48972 |
0.846 |
|
MF |
1125 |
2305 |
1517 |
1489 |
1572 |
8008 |
0.138 |
|
EF |
156 |
350 |
149 |
97 |
162 |
914 |
0.016 |
|
TOTAL |
6743 |
16493 |
11461 |
11823 |
11374 |
57894 |
1 |
As the analysis is based on actual accident data, the summation of the product of the accident-cause factors and its respective probabilities is equal to unity; indicating a 100% certainty of accident occurrence. This scenario is represented in mathematical form by Equation (1):
∑ {(Accident Cause factor) × (Accident Probability)} =1 (1)
Therefore, it follows from Equation (1) that:
HFpr(i)+ MFpr(j)+ EFpr(k)=1 (2)
Where pr(i), pr(j) and pr(k) are Accident-Cause probabilities of HF, ME and EF, respectively. Also, it is assumed that the coefficients HF, MF and EF are respectively equal to unity; that is,
The base model (Equation 1) is predicated on the assumption of 100% accident certainty. But in reality, this is not perfectly true; there exist as an equal likelihood of no accident as there is likelihood of accident occurrence as transport vehicles are in transit. To compensate for this scenario, therefore, the parameter, β, a summation of the interacting accident predictive factors, must be subtracted from the model output response (in this case, 1).
Where β = the uncertainty of accident occurring (i.e., the error term associated with the assumption that accident occurred when it actually did not occur). For n number of predictive factors, the parameter, β becomes βi,j,k,…n, where i,j,k and n are the respective predictive factors. For purpose of convenience and clearer illustration, the number of predictive factors n has been limited to 3 (i.e. n = 3); hence βi,j,k.
By definition, βi,j,kis the probability of either Ҳi occurring or Ҳj occurring or Ҳk occurring (=Ҳi+ Ҳj + Ҳk).
Therefore,
βi,j,k= Ҳi+ Ҳj + Ҳk (3)
Hence, Equation (2) becomes,
HFpr(i)+ MFpr(j)+ EFpr(k) = 1─ β (4)
Let ҳi, ҳj and ҳkbe the fractional score of Ai, Bj and Ck, respectively (See Table 2.
Then,
pr(i)Ҳi + pr(j)Ҳj + pr(k)Ҳk + β = 1 (5)
Since Ҳi, Ҳj, and Ҳk are respectively proportional to Ai, Bj and Ck, it therefore implies that:
µ (Ҳi,Ҳj,Ҳk) =pr(i)Ҳi + pr(j)Ҳj + pr(k)Ҳk + βijk (6)
Equation (6) is the required accident prediction model for transport vehicles.
Where:
µ = Probability of Accident occurring
(Ҳi, Ҳj, Ҳk)= a combination of the ith, jth and kth predictive factors
βi,j,k = the uncertainty of accident occurring when the ith, jth and kth predictive factors interplay;
µ (Ҳi, Ҳj, Ҳk) = accident probability when the ith, jth and kth predictive factors are combined.
2.1. Accident Predictive-Factors Combinations
There are three sets of accident-predictive factors Ai, Bj and Ck, respectively. Each set of predictive factors contains three distinct elements. The combination design is such that each element of a set combines with one element of each of the remaining two sets to form another set {ai,bj,ck}. The combination that yields the probability of accident occurring (µ)most approximately equal to zero is the safest combination.
2.1.1. Number of Possible Predictive-Factor combinations
To determine the number of possible predictive factor combination sets:
Let n be the total number of elements in Ai, Bj and Ck; r the number of elements in a set of the expected combination {ai,bj,ck}; k the number of elements that must be repeated in the resultant combination Brualdi eta l. (2010).
In general, the number of combinations of n items taking r at a time is given as (Brualdi, 2010):
![]() (7)
(7)
For repeated combination, the number of ways to obtain the expected set of elements is given as (Brualdi, 2010):
![]() (8)
(8)
But in the case of this conditioned combination, k elements must not be repeated in the set {ai,bj,ck}. k is therefore, subtracted from the result of the repeated combination to obtain the required conditioned combination (Brualdi, 2010). The number of ways to obtain the conditioned elements {ai,bj,ck}is given as:
![]() (9)
(9)
Since any element of a set must not be repeated in the combination, k is therefore assigned a value of 1. To determine the number of combinations of the set {ai,bj,ck}, Equation (9) is solved by substituting n, r and k values into the equation.
2.2. Accident Predictor Programming
The accident predictor interface runs on the Excel spreadsheet. The software uses Excel command programming and is based on the characteristics of the accident predictive factors associated with the model. In the programming, the following parameters are considered: Ҳi, on column ‘F’ row ‘i’ [Fi], Ҳj, on column ‘F’ row ‘j’ [Fj], Ҳk, on column ‘F’ row ‘k’ [Fk], ҲiPrion column ‘L’ row ‘i’[Li], ҲjPrjon column ‘M’ row ‘j’ [Mj], ҲKPrKon column ‘N’ row ‘K’ [NK], βi,j,kon column ‘O’ row ‘i,j,k’ [Oi,j,k] and µ(i,j,k)on column ‘P’ row ‘i,j,k’ [Pi,j,k]. The parameter µ(i,j,k) is the final output response of the accident calculator; the likelihood of accident occurrence as predicted by the model.
2.2.1. Accident Predictor Interface
An Accident Predictor interface was programmed to eliminate the complexity involved in computing the accident occurrence probability indices. The software is user-friendly as it requires no special expertise. To use the calculator, one only needs to determine the accident predictive-factor scores and insert them into the appropriate fields, then press the 'enter' key and the calculator displays the accident occurrence probabilities in a yellow-coloured column at the extreme right-hand side.
To adjust or edit any of the predictive-factor scores, double click the 'entry' to edit, then press the 'esc' key to return. The calculator is also colour coded to enhance clarity of computed results. The different colours used on the calculator are interpreted by the 'colour key' located at the bottom left of the calculator. The shaded arrow near the colour keys indicates that the entries below it is adjustable.
In order to validate the developed accident prediction model, the various possible combinations of the predictive factors (age of the driver, maintenance frequency and distance of travel) are considered and then integrated into the model. The possible accident predictive factor combinations are obtained and presented in Table 5
Table 5
|
Table 5 Possible Combinations of
Predictive Factors |
|||||
|
Combination i,j,k |
|||||
|
1 |
A1,
B1, C1 |
10 |
A2,
B1, C1 |
19 |
A3,
B1, C1 |
|
2 |
A1, B1, C2 |
11 |
A2, B1, C2 |
20 |
A3, B1, C2 |
|
3 |
A1,
B1, C3 |
12 |
A2, B1,
C3 |
21 |
A3,
B1, C3 |
|
4 |
A1, B2, C1 |
13 |
A2, B2, C1 |
22 |
A3, B2, C1 |
|
5 |
A1,
B2, C2 |
14 |
A2,
B2, C2 |
23 |
A3,
B2, C2 |
|
6 |
A1, B2, C3 |
15 |
A2, B2, C3 |
24 |
A3, B2, C3 |
|
7 |
A1,
B3, C1 |
16 |
A2,
B3, C1 |
25 |
A3,
B3, C1 |
|
8 |
A1, B3, C2 |
17 |
A2, B3, C2 |
26 |
A3, B3, C2 |
|
9 |
A1,
B3, C3 |
18 |
A2, B3,
C3 |
27 |
A3,
B3, C3 |
|
Total Combinations = 27 |
|||||
3. RESULTS AND DISCUSSION
The developed accident prediction model was tested by integrating the various possible combinations of the concurrent predictive factors, as determined, into the model to predict the likelihood of accident occurrence. The model gave an output that ranged from 0 – 1; values close to 0 mean low accident probability while values close to 1 depicted high accident occurrence probability.
There are three sets of accident-predictive factors Ai, Bj and Ck, respectively. Each set of predictive factors contains three distinct elements: Ai={A1,A2,A3}; Bj={B1,B2,B3}; Cj= {C1,C2,C3}.The combination design is such that each element of a set combines with one element of each of the remaining two sets to form another set {ai,bj,ck}.
To determine the number combinations of the set {ai,bj,ck},we then solve equation 9 by substituting n = 9, r = 3 and k = 1 into the equation.
Hence, the total number of required combinations for the set {ai, bj, ck} is 27 ways or combinations. The 27 possible combinations of the predictive factors (age of the driver, maintenance frequency and distance of travel) are considered and summarized in Table 6.
Table 6
|
Table 6 Accident Probability (µi,J,K) of the Various Possible
Combinations |
|||||
|
Combination i,j,k |
µi,j,k |
Combination i, j, k2 |
µi, j, k3 |
Combination i, j, k4 |
µi,j,k |
|
A1, B1, C1 |
0.8098 |
A2, B1, C1 |
0.5495 |
A3, B1, C1 |
0.2892 |
|
A1, B1, C2 |
0.8124 |
A2, B1, C2 |
0.5521 |
A3, B1, C2 |
0.2918 |
|
A1, B1, C3 |
0.8252 |
A2, B1, C3 |
0.5549 |
A3, B1, C3 |
0.2946 |
|
A1, B2, C1 |
0.8359 |
A2, B2, C1 |
0.5757 |
A3, B2, C1 |
0.3154 |
|
A1, B2, C2 |
0.8386 |
A2, B2, C2 |
0.5783 |
A3, B2, C2 |
0.318 |
|
A1, B2, C3 |
0.8413 |
A2, B2, C3 |
0.581 |
A3, B2, C3 |
0.3208 |
|
A1, B3, C1 |
0.8621 |
A2, B3, C1 |
0.6018 |
A3, B3, C1 |
0.3416 |
|
A1, B3, C2 |
0.8648 |
A2, B3, C2 |
0.6045 |
A3, B3, C2 |
0.3442 |
|
A1, B3, C3 |
0.8675 |
A2, B3, C3 |
0.6072 |
A3, B3, C3 |
0.3469 |
|
µi= Accident Probability of
the ith combination |
|||||
Table 6 shows all the possible combinations considered. 66.67% of the total combinations have accident occurrence probabilities greater than 0.5. This implies a high accident potential. The remaining 33.33% has accident probability less than 0.5. Hence, vehicles are considered safer under these conditions. Generally, A1, B3, C3 combination gave the highest probability value of 0.8675 while A3, B1, C1 combination gave the least probability value of 0.2892. A more robust table showing the explanation of the various combinations is presented in Table 7.
Table 7
|
Table 7 Predictive Factor Combination with Explanation |
|||||
|
Combination i,j,k |
Combination i, j, k |
Explanation |
Combination i, j, k |
Explanation |
|
|
A1,
B1, C1 |
Combination of driver age (18-38), maintenance
frequency (Regular) and distance of travel (C ≤ 250 KM) |
A2, B1, C1 |
Combination of driver age (39-59), maintenance
frequency (Regular) and distance of travel (C ≤ 250 KM) |
A3, B1, C1 |
Combination of driver age (60+), maintenance
frequency (Regular) and distance of travel (C ≤ 250 KM) |
|
A1, B1, C2 |
Combination of driver age (18-38), maintenance
frequency (Regular) and distance of travel (250≤C≤ 500 KM) |
A2, B1, C2 |
Combination of driver age (39-59), maintenance
frequency (Regular) and distance of travel (250≤C≤ 500 KM) |
A3, B1, C2 |
Combination of driver age (60+), maintenance
frequency (Regular) and distance of travel (250≤C≤ 500 KM) |
|
A1,
B1, C3 |
Combination of driver age (18-38), maintenance
frequency (Regular) and distance of travel (C ≥ 250 KM) |
A2, B1, C3 |
Combination of driver age (39-59), maintenance
frequency (Regular) and distance of travel (C ≥ 250 KM) |
A3, B1, C3 |
Combination of driver age (60+), maintenance
frequency (Regular) and distance of travel (C ≥ 250 KM) |
|
A1, B2, C1 |
Combination of driver age (18-38), maintenance
frequency (Irregular) and distance of travel (C ≤ 250 KM) |
A2, B2, C1 |
Combination of driver age (39-59), maintenance
frequency (Irregular) and distance of travel (C ≤ 250 KM) |
A3, B2, C1 |
Combination of driver age (60+), maintenance
frequency (Irregular) and distance of travel (C ≤ 250 KM) |
|
A1,
B2, C2 |
Combination of driver age (18-38), maintenance
frequency (Irregular) and distance of travel (250≤C≤ 500 KM) |
A2, B2, C2 |
Combination of driver age (39-59), maintenance
frequency (Irregular) and distance of travel (250≤C≤ 500 KM) |
A3, B2, C2 |
Combination of driver age (60+), maintenance
frequency (Irregular) and distance of travel (250≤C≤ 500 KM) |
|
A1, B2, C3 |
Combination of driver age (18-38), maintenance
frequency (Irregular) and distance of travel (C ≥ 250 KM) |
A2, B2, C3 |
Combination of driver age (39-59), maintenance
frequency (Irregular) and distance of travel (C ≥ 250 KM) |
A3, B2, C3 |
Combination of driver age (60+), maintenance
frequency (Irregular) and distance of travel (C ≥ 250 KM) |
|
A1,
B3, C1 |
Combination of driver age (18-38), maintenance
frequency (Reactive) and distance of travel (C≤ 250 KM) |
A2, B3, C1 |
Combination of driver age (39- 59), maintenance
frequency (Reactive) and distance of travel (C≤ 250 KM) |
A3, B3, C1 |
Combination of driver age (60+), maintenance
frequency (Reactive) and distance of travel (C≤ 250 KM) |
|
A1, B3, C2 |
Combination of driver age (18-38), maintenance
frequency (Reactive) and distance of travel (250≤C≤ 500 KM) |
A2, B3, C2 |
Combination of driver age (39-59), maintenance
frequency (Reactive) and distance of travel (250≤C≤ 500 KM) |
A3, B3, C2 |
Combination of driver age (60+, maintenance
frequency (Reactive) and distance of travel (250≤C≤ 500 KM) |
|
A1,
B3, C3 |
Combination of driver age (18-38), maintenance
frequency (Reactive) and distance of travel (C≤ 250 KM) |
A2, B3, C3 |
Combination of driver age (39-59), maintenance
frequency (Reactive) and distance of travel (C≤ 250 KM) |
A3, B3, C3 |
Combination of driver age (60+), maintenance
frequency (Reactive) and distance of travel (C≤ 250 KM) |
|
Ai= Age of driver i = 1,2,3 |
Bj = Maintenance frequency j = 1,2,3 |
Ck = Distance of travel k = 1,2,3 |
|||
From Tables 6 and 7, it could be deduced that accident probability of a vehicle increases as the distance of travel increases and/or maintenance frequency of the vehicle reduces. More so, transport companies are advised against employing drivers between the ages of 18-38 as accident probability is very high within this age.
4. CONCLUSION
In an attempt to tackle the problems posed by road accidents in our clime, particularly the transport vehicles accidents, an accident prediction model has been developed in this paper for transport vehicles. This model will help in reducing accidents involving transport vehicles and their drivers if strictly adhered to. The results of the predictions suggest the probabilities of accident occurrence and as well offer informed guide for fleet operators’ decision making.
The focus was on transport vehicles because study has shown the group to be involved in road accident more often than the private vehicles drivers. More so any accident occurrence involving this target group would have a chain effect as several families and their livelihood may be drastically affected.
The study has shown, among other things, that of the various accident-occurrence Probabilities, µ (i, j, k) for the various accident predictive-factor combinations, about 66.67% of the total combinations have accident occurrence probabilities greater than 0.5. This implies a high accident potential. The remaining 33.33% has accident probability less than 0.5. Generally, [A1, B3, C3] combination gave the highest probability value of 0.8675 while combination [A3, B1, C1] gave the least probability value of 0.2892. Hence, vehicles are considered safer under these combinations of these low accident-occurrence probability and the safest among all being combination [A3, B1, C1] with a value of 0.2892.
The results also show that accident probability of a vehicle increases as the distance of travel increases and/or maintenance frequency of the vehicle reduces. The transport companies are therefore advised against employing drivers of the age range of 18-38 as accident probability is very high within this age range. However, they are advised to embrace combination [A3, B1, C1] for minimum accident vehicular accident involvement.
For effective accident prediction, the accident predictive factors are of chief importance. The transport vehicle owners or fleet managers have to consider critically the predictive factors, score them and then integrate them into the model for the accident prediction. Furthermore, to enhance speedy and accurate accident calculations for accident predictions, an excel-based accident prediction software interface has been developed for the model.
CONFLICT OF INTERESTS
None.
ACKNOWLEDGMENTS
Authors are grateful to the entire staff of Mechanical Engineering of Michael Okpara University of Agriculture, Umudike and the entire staff of the Federal Road Safety Corpse, Abia State, for providing all necessary data that made this research work a success.
REFERENCES
Abdulhafedh,
A., (2017). Road Crash Prediction Models: Different Statistical Modeling Approaches. Journal of Transportation Technologies, 2017, 7:190-205
Beirness, D. J. and Beasley,
E., (2011). A Comparison
of Drug- and Alcohol-Involved Motor
Vehicle Driver Fatalities.
Canadian Centre on Substance Abuse, Ottawa, 2011
Brualdi, Richard A., (2010). Introductory Combinatorics (5th Ed.), Pearson Prentice Hall, 2010, ISBN 978-0-13-602040-0.
FRSC and Balogun Y. (2006). Research and Development Opinions, Federal Road Maintenance Agency January/February 2006 Pg. 13-16
FRSC, (2016). FRSC Annual Report 2016 ; www.frsc.gov.ng/publications, Retrieved on April 8, 2018
Gupta, B.L. and Gupta A., (2009).
Different Modes of Transportation : Roads, Railways, Bridges, Tunnels & Harbour. Dock
Engineering, 2009. Chapter 1;
pp 1.2-1.4.
Hermitte, T., (2012). Review of Accident Causation Models used in Road Accident Research of the EC FP7 project DaCoTA, 2012
Kalyoncuoğlu, F.S, & Tığdemir, M., (2014). The Effects of Daily Driven Distance and Age Factor on the Traffic Accidents. Transportation Department, Engineering Faculty, Civil Engineering, 2014 https://doi.org/10.7307/ptt.v26i3.1306
Oyedepo, O. J., (2010). Accident Prediction Models for Akure - Ondo Carriageway, Ondo State Southwest Nigeria : Using Multiple Linear Regressions. An International Multi-Disciplinary Journal, Ethiopia Vol. 4 April, 2010, ISSN 2070-0083. https://doi.org/10.4314/afrrev.v4i2.58286
Oyetunji, M.O., Oladeji, F.A., Falana, P.A., & Idowu, P.A., (2017). Prediction of Road Traffic Accident in Nigeria Using Naïve Baye's Approach. Advances in Multidisciplinary & Scientific Research Journal, volume 3(1), 2017, Pp 23-30
https://doi.org/10.4236/jtts.2017.72014
|
|
 This work is licensed under a: Creative Commons Attribution 4.0 International License
© ShodhAI 2024. All Rights Reserved.