|
|
|
|
Cloud Computing Infrastructure Data Security: An Optimized Virtualization Model
Nseobong Archibong Michael 1![]() , Friday E. Onuodu 2
, Friday E. Onuodu 2![]() , E. E. Ogheneovo 2
, E. E. Ogheneovo 2
1 Lecturer,
Department of Mathematics and Computer Sciences, Ritman University, Mkpatak,
Nigeria
2 Lecturer,
Department of Computer Science, University of Port Harcourt, Nigeria
|
|
|
ABSTRACT |
|
|
The study
suggests using an improved and robust virtualization model to apply an
intelligent-based design to data security monitoring in a cloud computing
infrastructure. The primary problem with cloud computing, the concurrently
concerning malicious activity, makes this technology notable. When we discuss
an architecture that allows for easy, on-demand network access to a shared
pool of reconfigurable computing resources—such as servers, networks,
storage, apps, and services—we are referring to cloud computing. This
requires little administration work or communication between the service
provider and customer to quickly deploy and discharge. A virtualized approach
was created in this work to improve the monitoring of data security. Adopting
the Structured System Analysis and Design Methodology, dataflow diagrams,
use-case diagrams, sequence diagrams, and diagrams created with the Unified
Modelling Language (UML) were utilized to accomplish the desired design.
Robust repositories provided five hundred (500) datasets, of which thirty
percent were used for training and seventy percent were used for testing. The
number of adopted technologies, the number of adopted design tools, the
number of adopted algorithms, and the number of tested records were all used
as parameters to analyze and assess the performance of both systems.
According to the performance review, the new system performed better than the
old one, achieving an accuracy rate of 1.07% as opposed to the old system's
0.48% accuracy rate. The recently created model focused specifically on
financial fraud and was intended to detect fake data in cloud computing infrastructure.
Because financial frauds against property involve the illegal transfer of
property ownership for an individual's personal use and benefit, this study
could be helpful to corporate organizations, anti-corruption agencies, and
researchers who have a keen interest in the subject matter. Additionally, the
new system was further optimized with the use of deep neural networks and
logistic regression techniques. |
|||
|
Received 25 July 2024 Accepted 22 August 2024 Published 18 September 2024 Corresponding Author Nseobong
Archibong Michael, nsemike@yahoo.com DOI 10.29121/ShodhAI.v1.i1.2024.8 Funding: This research
received no specific grant from any funding agency in the public, commercial,
or not-for-profit sectors. Copyright: © 2024 The
Author(s). This work is licensed under a Creative Commons
Attribution 4.0 International License. With the
license CC-BY, authors retain the copyright, allowing anyone to download,
reuse, re-print, modify, distribute, and/or copy their contribution. The work
must be properly attributed to its author.
|
|||
|
Keywords: Memory Virtualization, Nested Virtualization,
Distributed File System, Logistic Regression Technique, and Cloud Computing |
|||
1. INTRODUCTION
One of the most pervasive evils of our time is data fraud, the extent of which no one knows, but it hardly goes a day without some reference in the media to yet another fraud or alleged fraud. Studies on various aspects of cloud computing and detection of data fraud in cloud computing using different tools have been undertaken by different expert, in different parts of the world.
Because data fraud is sometimes seen as a victimless crime, lawmakers and the public may not give it the same attention as they do other crimes Hapman and Smith (2011). Nonetheless, a growing number of specialists increasingly view fraud as being on par with or even more serious than some violent crimes Rebovich & Kane (2002). Data fraud can have far-reaching effects on an organization's operations, finances, legal standing, and strategy. It is imperative that enterprises address this issue as a result. Notably, data fraud encompasses areas such as contract and tort law and goes beyond criminal situations Podgor (1999). The term "fraud" has many meanings in different nations and organizations, and it can be interpreted in different ways. It can refer to both the actual act of deception through false claims as well as the intention to do so. Fraud is defined as misleading people or organizations by dishonest behavior, such as making false claims, acting in an untruthful manner, or omitting something, with the goal of receiving financial or other benefits from the government or avoiding liabilities Commonwealth of Australia (2000). In a similar vein, the Government of Western Australia (1999:9) defines data fraud broadly to include both financial and non-financial gains, such as stealing time or resources from the business. Any dishonest or deceptive actions taken with the intention of receiving government advantages fall under this description.
To elaborate, cloud computing is a scalable and adaptable method of gaining access to a shared pool of computing resources (such as servers, networks, storage, apps, and services) via the internet. This model facilitates easy resource provisioning and de-provisioning at user request, with little administrative work and direct communication with service providers, making it possible to efficiently and on-demandly access computing capabilities Mell and Grance (2009).
Data fraud is a major problem in modern computing, and cloud computing infrastructures are particularly susceptible to it. This issue is made worse by the lack of sophisticated virtualization models for data security. As a result, individuals, organizations, and companies that rely on cloud computing and store their data online face significant risks of data fraud and other security threats. Unauthorized access to company data is a widespread occurrence, with accounts frequently being hacked and compromised. There is a significant risk of total data loss in the cloud, and it can be difficult to ensure provider data protection. In addition, students have been known to hack into school accounts and make unauthorized changes to data, such as adding their names to records without paying fees, which compromises the integrity of the school's cloud-based records.
In this research, a suggested cloud computing-based approach for tracking and identifying security risks to vital infrastructure systems is presented. An operations center, cloud infrastructure, and monitoring agents make up the three main parts of the system. Advancements in machine learning algorithms in recent times have demonstrated increased efficacy in identifying instances of data fraud in cloud computing. Nevertheless, robust machine learning techniques were not applied in this work to detect fraud. Vishal (2018), in contrast, used a machine learning-based rule-based and game-theoretic method for online credit card fraud detection. In order to optimize payoffs, their method simulates the interactions between an intrusive party and an intrusion detection system as a multi-stage game. While their technique to credit card fraud detection works well, the rule-based approach has drawbacks because it is dependent on rigid rules and could miss concealed patterns of incursion Ituma et al. (2020), James et al. (2012), Ekong et al. (2024), James et al. (2023). Conversely, the goal of the proposed project is to create a system that can identify even minute and undetectable fraud behaviors.
1.1. Overview of Deep Learning
Artificial neural networks (ANNs) are the mainstay of modern deep learning models, with CNNs serving as the main architecture. However, some models also include other elements, including latent variables or propositional formulae, which are organized in a layered structure in deep generative models. These models, in which nodes are arranged hierarchically, include deep belief networks and deep Boltzmann machines Ciresan et al. (2012).
In deep learning, the input data is transformed into a more abstract and composite representation by each layer that comes after it. In image recognition, for example, the first input could be a pixel matrix, which the first layer abstracts into edges, and the second layer composes and encodes the edge configurations. More intricate traits, such as nose and eyes, may be encoded in later layers, eventually resulting in the fourth layer's identification of a face. Interestingly, deep learning can automatically figure out which traits are best to extract at each level James et al. (2023), James et al. (2022), James et al. (2011), James et al. (2012), James & Ben Oto-Abasi (2012), James et al. (2010). Interestingly, deep learning can automatically figure out which traits are best to extract at each level. To reach the appropriate degree of abstraction, some manual tweaking might still be required, such as modifying the quantity and dimensions of the layers Krizhevsky et al. (2012).
For unsupervised learning tasks, using deep learning algorithms is advantageous because there is a large amount of unlabeled data compared to labeled data James et al. (2023), James et al. (2022), James et al. (2024). Notably, neural history compressors and deep belief networks are examples of deep structures that can be trained autonomously and can unearth important patterns and relationships in the data Krizhevsky et al. (2012).
1.2. Interpretations of Deep Learning
Generally, probabilistic inference or the universal approximation principle are used to interpret deep neural networks Marblestone et al. (2016). The universal approximation theorem claims that a single hidden layer in a feedforward neural network may approximate continuous functions. It was initially demonstrated for sigmoid activation functions by George Cybenko in 1989. Kurt Hornik later extended this idea to multi-layer structures in 1991. Further studies have shown that non-bounded activation functions, such as the rectified linear unit, can also be approximated using this universal ability Olshausen (1996).
The deep neural network universal approximation theorem addresses networks with constrained width but permits growing depth. It has been demonstrated that any Lebesgue integrable function may be approximated by a deep neural network with ReLU activation as long as its width is strictly larger than the input dimension. On the other hand, if the width is the same as the input dimension or smaller, the deep neural network cannot perform universal approximation.
Originating in the field of machine learning, the probabilistic interpretation of deep neural networks places a strong emphasis on inference, training, and testing. Activation nonlinearities are seen as cumulative distribution functions, with an emphasis on optimization-based fitting and generalization. Schulz & Behnke (2012).
1.3. Deep Neural Networks
An artificial neural network (ANN) with numerous layers between the input and output layers is called a deep neural network (DNN). Through a sequence of mathematical processes, the DNN learns to turn inputs into outputs that can reflect linear or non-linear relationships Umoh et al. (2012), Onu et al. (2015), Ituma et al. (2020). The probability of each potential output, such as identifying dog breeds in an image, is calculated by the network as it analyzes inputs James et al. (2017), Gregory et al. (2023), James et al. (2024). After that, the user can examine the suggested labels and choose the likelihood threshold they want. Since each mathematical operation is regarded as a layer, DNNs are called "deep" networks because of their numerous layers, which contribute to their complexity Onu et al. (2015), James et al. (2023).
Because Deep Neural Networks (DNNs) can produce compositional models, they can be used to simulate complex non-linear relationships. These models depict objects as a hierarchical assembly of fundamental components, with further layers allowing the fusion of traits from earlier layers. As shown by Krizhevsky et al. (2012), this enables DNNs to possibly simulate complex data using fewer units than a shallow network with equivalent performance.
Deep architectures are variants on a few core techniques, each of which is effective in a particular domain. However, unless they have been evaluated on the same datasets, comparing the performance of different architectures can be difficult James et al. (2024), James et al. (2024).
Typically, feedforward networks—in which data moves unidirectionally from the input layer to the output layer without feedback loops—are used to describe Deep Neural Networks (DNNs). The DNN first builds a virtual neural map by giving connections between neurons arbitrary weights. After that, the network multiplies the inputs by weights to produce an output that ranges from 0 to 1. In the event that a pattern is not correctly detected by the network, an algorithm modifies the weights by amplifying the significance of specific parameters until the appropriate mathematical transformation is found to process the data completely.
1.4. Logistic Regression
The objective of logistic regression, also known as the logit model, is to estimate the parameters of a logistic model, which represents a binary dependent variable. In its most basic form, logistic regression uses a logistic function to model a binary outcome variable, although more complex extensions exist. This method can be extended to classify multiple events, like identifying objects in an image (e.g., cat, dog, lion) Okafor et al. (2023), James et al. (2017), Ekong et al. (2024). Each detected object is assigned a probability score between 0 and 1, with the sum of all scores equal to 1 (e.g., pass/fail using an indicator variable labeled "0" and "1"). The logistic model calculates the log-chances (logarithm of the odds) for the result labeled "1" as a linear combination of one or more predictor variables. These predictor variables might be continuous (any real value) or binary (two classes, indicated by an indicator variable). From 0 (complete certainty of outcome "0") to 1 (absolute certainty of outcome "1"), the resulting probability of the outcome labeled "1" ranges. The logistic function gives the model its name by converting log-odds into probability. The model is also known by other names since the log-odds scale is measured in units called logits, which is short for logistic units. The logistic function can be replaced with a different sigmoid function to employ alternative models, such as the probit model. The distinctive feature of the logistic model is that, when one of the independent variables is increased, it multiplicatively increases the probability of a specific event at a constant rate, with each independent variable having a different parameter. The odds ratio for binary dependent variables is generalized by this feature Tolles & Meurer (2016).
The dependent variable in binary logistic regression has two levels and is categorical. Multinomial logistic regression is used for outputs with more than two values, while ordinal logistic regression (e.g., proportional odds ordinal logistic model) is used if the categories are ordered. Rather of performing classification itself, the logistic regression model uses inputs to predict the probability of an output. However, by establishing a cutoff value and classifying inputs accordingly, it can be used to build a classifier. Logistic regression coefficients are usually obtained by an iterative procedure rather than a closed-form equation, in contrast to linear least squares. A key figure in the creation and acceptance of logistic regression as a general statistical model was Joseph Berkson Cramer (2002).
1.5. Applications of Logistic Regression
Applications for logistic regression are numerous in machine learning, medicine, and the social sciences, among other domains. For example, Boyd et al. used logistic regression to establish the Trauma and Injury Severity Score (TRISS), which is frequently used to predict death in injured patients. With the aid of logistic regression, numerous more medical scales for evaluating patient severity have also been created. Additionally, based on patient parameters (age, sex, BMI, blood test results, etc.), logistic regression can predict the risk of certain diseases, such as diabetes and coronary heart disease. In the social sciences, it can also be used to forecast voting behavior (e.g., the voting preferences of Nepalese voters) by taking into account variables like age, income, sex, race, place of residence, and past voting records. Engineering can also make use of this technique, particularly when estimating the likelihood that a certain process, system, or product would fail. In marketing applications, it is also employed for things like forecasting a customer's likelihood to buy a product or cancel a subscription, among other things Ekong et al. (2024), Ekong et al. (2024), Chukwu et al. (2023), Okafor et al. (2023). It can be used to forecast an individual's propensity to choose to work, and in the business world, it can be used to forecast the probability that a homeowner will fail on a mortgage. Natural language processing uses conditional random fields, which are logistic regression extended to sequential data Berry (1997).
1.6. Machine Learning
The cutting-edge field of machine learning enables computers to perform better without explicit programming by learning from experience. Machine learning algorithms, a crucial area of artificial intelligence, use sample data to create predictive models that help guide well-informed decisions. These algorithms solve difficult problems where traditional coding fails, such as email filtering and computer vision, transforming sectors with never-before-seen efficiency Arthur (2006). Because both machine learning and computational statistics aim to make predictions using computational techniques, they are closely related fields. Machine learning relies heavily on mathematical optimization, which offers fundamental methods, conceptual underpinnings, and real-world applications. Another closely related subject, data mining, focuses on using exploratory data analysis and unsupervised learning to find insights. Machine learning is frequently referred to as predictive analytics in the context of business applications, emphasizing its emphasis on forecasting and well-informed decision-making.
1.7. Virtualization/Virtualization Architecture
The process of virtualization entails generating virtualized copies of different IT components, such as networks, software, hardware, and storage Graziano (2013). Virtualization began in the 1960s as a way to allocate resources on mainframes, but its use and scope have since grown Graziano (2013). This technique facilitates optimal resource use and isolation by letting many operating systems, virtual machines (VMs), or instances of a single OS to run concurrently on a single physical system.
1.8. Advantages of Virtualization
Virtualization increases resource efficiency and flexibility by lowering energy costs, boosting hardware efficiency, and allowing several operating systems and applications to run concurrently on a single server, and also:
1) Provides ability to manage resources effectively.
2) Increases efficiency of IT operations.
3) Provides for easier backup and disaster recovery.
4) Increases cost savings with reduced hardware expenditure.
1.9. Disadvantages of Virtualization
1) Software licensing costs.
2) Necessity to train IT staff in virtualization.
1.10. Virtualization Architecture
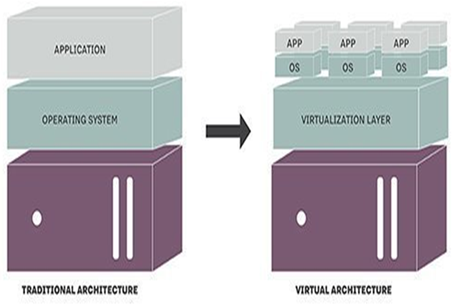
A conceptual framework known as a virtualization architecture describes how parts of an operating system, server, storage device, or network resource are organized and connected when they are virtualized. Essentially, cloud computing is made possible by virtualization software, which separates physical infrastructure into several specialized resources Angeles (2014). From a single control point, this architecture offers an integrated management strategy for network devices, applications, and both real and virtual resources. Virtualization software enhances efficiency and flexibility by enabling various operating systems and applications to run simultaneously on a single server, according to Mike Adams, director of product marketing at VMware. Models for traditional and virtualized architecture are shown in the accompanying figure.
1.10.1. Type of Virtualization Architectures
Several methods can be used to apply virtualization to different system levels, such as the hardware, desktop, operating system, software, memory, storage, data, and network. Full virtualization is one method that does this by completely isolating the physical hardware from the virtual environment and achieving complete abstraction.
Figure 1
|
Figure 1 Traditional and Virtual
Architectures Source Rouse, 2018 |
1.11. Analysis of the Proposed System
By adding a data fraud detection mechanism that makes use of Deep Neural Network and Logistic Regression Machine Learning techniques, the suggested system improves upon the current cloud computing system (Figure 1). This hybrid method lowers latency and increases text classification accuracy by combining K-nearest neighbor and N-gram techniques. N-grams are nested patterns made up of n elements (phonemes, syllables, letters, and words) that are taken from speech or text collections. When employing words, these patterns can be referred to as bigrams (2 items), trigrams (3 items), unigrams (1 item), or shingles. The following elements make up the suggested system:
1) Scanned
Data Interface
With the help of this component, users can scan data objects linked to possible criminal suspects and create templates that specify a collection of properties particular to a given entity. Rather of immediately accessing or altering data sources or targets, this template is used to design processes that communicate with interfaces.
2) Deep
Neural Network
This part displays a particular kind of machine learning that is distinguished by a three-layer neural network. While not fully replicating the operation of the human brain, these multi-layered neural networks are designed to "learn" from large datasets and gradually improve their performance.
3) Regression
This part examines a dataset of independent factors to forecast the probability of an occurrence, like voting or not. With the dependent variable ranging from 0 (impossible) to 1 (certain), the result is expressed as a probability, enabling a more accurate evaluation of the event's likelihood.
Advantages of Virtualization
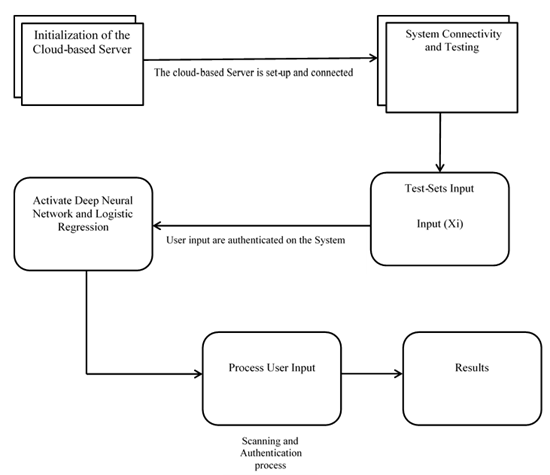
A data visualization tool called a dataflow diagram (DFD) shows how data moves through a system or process, usually an information system. As seen in Figure 2, it offers a clear view of the inputs and outputs of each entity and process. In contrast to other diagrams, DFDs do not show loops, decision rules, or control flows; instead, they only show the movement of data. Processes, data flows, data warehouses, and terminators are the four main components of the DFD that may be examined and studied from different angles.
A process, also known as a function or transformation, is a component of a system that converts inputs into outputs. Depending on the type of notation, a process can be represented by a circle, oval, rectangle, or rectangle with rounded corners. The process name can be one word, a brief sentence, or a phrase that expresses the essence of the process.
The transfer of data (or materials) between components of a system is referred to as data flow (or flow). Unless it is obvious from the linked entities, flows represented by arrows should be labeled to identify the kind of information (or material) being moved. Only one kind of data (or material) should be carried by flows, which can be unidirectional or bidirectional based on the logical dependencies between entities (such as a query and answer). Data warehouses, terminators, and processes are connected by flows, which show how information (or materials) is transferred between them.
The process of creating the Data Flow Diagram (DFD) involves cooperation between analysts, stakeholders, and system users. It is a means of communication for project contractors as well as system developers. To achieve clarity and broad understanding, entity names in the DFD should be:
1) Adapted to the intended audience, whether domain specialists, amateur users, or professionals
2) Generalized, excluding names or specific people to preserve objectivity and concentrate on the tasks carried out
This strategy guarantees that the DFD will always be a useful tool for all parties concerned.
Figure 2
|
Figure 2 Dataflow Diagram of the
Proposed System |
Use-Case Diagram of the Proposed System
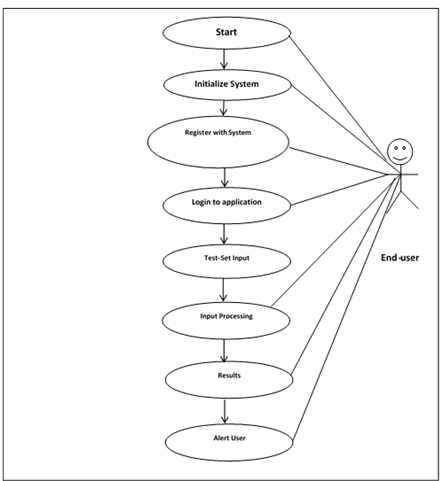
A Use-Case Activity Diagram illustrates the phases of the suggested system, as seen in Figure 3. This diagram, which shows a variety of use scenarios and user categories, graphically depicts possible user interactions with the system. Typically, elliptical or circular forms are used to depict use cases. The use case diagram, which is accompanied by other diagrams, gives a textual account of user tasks and system behavior from the viewpoint of the user. It provides a clear knowledge of user interactions and system functionality by outlining how the system reacts to user requests. Figure 3 displays a Use-Case Activity Diagram that illustrates the steps of the suggested system. Using a variety of use cases and user categories as examples, this diagram graphically depicts possible user interactions with the system. Typically, use cases are shown as elliptical or circular forms. The use case diagram, when combined with other diagrams, offers a textual account of user tasks and system behavior as seen from the user's point of view. A clear knowledge of user interactions and system functionality is provided by outlining how the system reacts to requests from users:
System: What is being described?
Figure 3
|
Figure 3 Use-Case Activity Diagram of the
Proposed System Design |
Unified Modelling Language Design of the Proposed
System
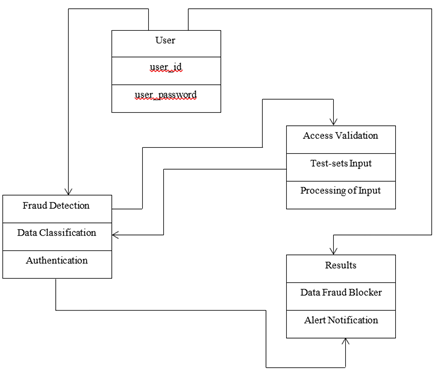
In software engineering, the Unified Modeling Language (UML) is a standardized language that provides a common foundation for visualizing system designs. Class diagrams are the most common type of UML diagram and include classes, interfaces, connections, and collaborations. These illustrations offer a static, object-oriented depiction of a system, emphasizing its composition and arrangement. In class diagrams, active classes are used to represent system concurrency. Class diagrams are the most commonly used diagrams during system creation because they are most useful for development purposes and effectively show a system's object orientation
In contrast, component diagrams show a set of components, including classes, interfaces, and collaborations, and their relationships, representing the implementation view of a system; object diagrams, on the other hand, are specific instances of class diagrams that are more applicable to real-world scenarios where systems are implemented. Consisting of objects and their relationships, similar to class diagrams, and providing a static view of the system, object diagrams are used to create practical prototypes of a system.
Software components are created during the design process by logically grouping things (such classes and interfaces) according to their relationships. The system's deployment architecture is then demonstrated by deployment diagrams, which explain how these parts are assigned to actual nodes. The deployment team mostly uses these diagrams to plan and carry out the deployment process because they give a visual depiction of the system's deployment view. The proposed system's UML diagram, which illustrates this deployment view, is shown in Figure 4.
Figure 4
|
Figure 4 UML Diagram of the
Proposed System |
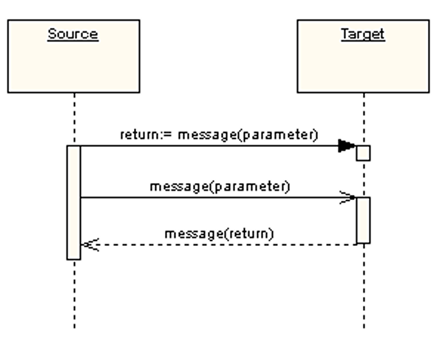
Sequence Diagram of the Proposed System
A sequence diagram is a type of UML diagram that shows the messages that are sent between objects in an interaction in a chronological order. It consists of messages that are sent over time between objects represented by lifelines. The messages that are exchanged between objects and the control structures that regulate their interactions are shown in this diagram. Sequence diagrams make it evident how objects interact and coordinate with one another by showing the flow of messages and control mechanisms.
Arrowhead styles in sequence diagrams denote the kind of message exchange:
1) Solid arrowheads denote synchronous calls, which function similarly to subroutine calls in that the caller must wait for a response.
2) Asynchronous communications are indicated by open arrowheads, which let the caller carry on processing without having to wait for a response.
3) Reply messages are indicated by dashed lines.
To facilitate concurrent processing, asynchronous calls are frequently employed in message-oriented middleware, event-driven systems, and multithreaded applications. Activation boxes, often called method-call boxes, are opaque rectangles on lifelines that show actions being taken in response to messages. They are intended to visualize the processing of messages.
Objects that invoke their methods communicate with one another, adding additional activation boxes at every processing level. It is possible to depict external communications entering the diagram from either the border (gate) or the filled-in circle (discovered message), denoting their origin outside the graphic.
Sequence diagrams are now more useful because of interaction fragments introduced by the Unified Modeling Language (UML). By representing smaller, modular parts of a broader interaction, these pieces enable more flexibility and specificity when simulating intricate systems. Interaction fragments offer a more accurate and nuanced depiction of the dynamics within a system by dissecting interactions into smaller parts.
Figure 5
|
Figure 5 Sequence
Diagram of the Proposed System |
Datasets
This section discusses the means of collecting all the information for training and testing the Proposed System and managing it in a way that maximizes the speed and comprehensiveness with which critical information can be extracted, analyzed and used.
Training Set
The training set was chosen when the suggested system was being learned. In addition, a supervised learning algorithm uses the training dataset to identify, or learn, the best variable combinations that produce an accurate predictive model. The training procedure aims to generate a fitted, or trained, model with good generalization to novel, unidentified data. To assess the fitted model's accuracy in categorizing fresh data, "new" instances from the held-out datasets (validation and test datasets) are used.
Testing Set
Although the test set and the training dataset are separate, they both have the same probability distribution. The suggested system passes the test if it matches the training set. Moreover, overfitting is typically indicated by a training dataset that fits the test dataset better than the training dataset. Furthermore, the test set is simply utilized to evaluate the suggested system's performance.
1.12. Design Specifications of the Proposed System
Table 1, Table 2 and Table 3 show the output specification, input specification and database design of the Proposed System.
Table 1
|
Table 1 Output Specification |
|
|
Input |
Expected output |
|
User
access validation (username + password) |
Login
successful |
|
Text Data Input for
Text Classification |
Test-sets successfully
accepted |
|
Classification
result |
Successful
classification output |
Table 2
|
Table 2 Input Specification |
|||
|
Field Name |
Field Type |
Null |
Default |
|
Text
Data Inputs |
Varchar |
No |
None |
Table 3
|
Table 3 Database Design |
|||||
|
Field name |
Data type |
Description |
Character length |
Missing value |
Alignment |
|
Text
Data |
Varchar |
Test-sets
for testing the system |
1000 |
None |
Center |
2. SYSTEM OUTPUT
Figure 6

|
Figure 6 Registered User Login Page |
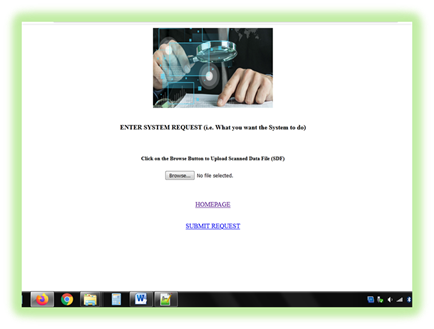
Figure 7
|
Figure 7 Scanned
Data File Upload Page |
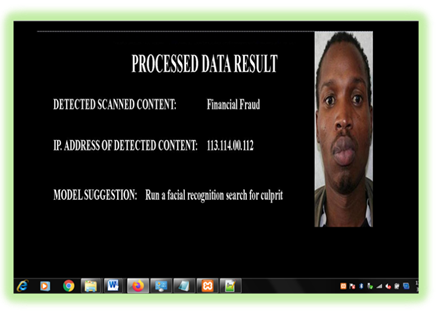
Figure 8
|
Figure 8 Processed
Data Result |
2.1. Positive Impact of the Proposed System
With the use of deep neural networks and logistic regression, the suggested system offers an improved text classifier model that can identify fake data while minimizing over-fitting problems, cutting down on latency, and increasing accuracy. Furthermore, sequence elements that come after are predicted using the probabilistic language model known as the n-gram model, which is based on (n-1)-order Markov chains. N-gram models are widely used in many different domains. N-gram models have two important benefits: scalability and simplicity. Small-scale experiments can be effectively scaled up by raising the value of n in models that capture more context and strike a balance between space and time complexity. In addition, the k-nearest neighbor (K-NN) algorithm is a unique data mining method that works very well for reliable and accurate text classification. K-NN is a supervised machine learning technique that predicts the class of new data points by using labeled datasets. Because of its resilience, it is frequently used as a benchmark to assess increasingly sophisticated classifiers, such as Support Vector Machines (SVM) and Artificial Neural Networks (ANN).
3. RESULTS AND DISCUSSION
The results of testing and deploying the new system for data fraud detection in comparison to the current system are shown in Table 1 and Table 2. The quantity of technologies, algorithms, design tools, and tested records employed in the two systems were among the evaluation's parameters. According to the performance review, the new system performed better than the old one, with an accuracy rate of 1.07% as opposed to 0.48%. This study draws attention to the serious difficulties presented by many forms of fraud, including credit card, insurance, tax return, mobile phone, and government procurement fraud, all of which require specific analysis methods in order to be detected. Effective strategies to stop electronic fraud crimes come from Knowledge Discovery in Databases (KDD), Data Mining, Machine Learning, and Statistics. When it comes to combating fraud brought on by flaws in internal control systems, data analytics is essential. Many fraud cases go undiscovered because traditional techniques, such depending on circumstantial evidence or whistleblower allegations, are frequently insufficient. Businesses use specialized data analytics techniques including data mining, regression analysis, clustering, and gap analysis to efficiently detect, prevent, and monitor fraud. Artificial intelligence techniques and statistical methods are the two main categories into which fraud detection techniques fall.
4. CONCLUSION
With an emphasis on financial crime, this paper offers a novel virtualization model for cloud computing infrastructure that is especially made to identify fake data. Financial fraud is a serious threat since it entails the unauthorized transfer of asset ownership for personal benefit. We incorporated cutting-edge methods, such as logistic regression and deep neural networks, to improve the model's efficacy in identifying and averting financial fraud in cloud computing settings.
The study's novel virtualization model did not include a physical implementation of hardware components and sensors in real cloud computing infrastructures; instead, it was restricted to simulating the tracking of financial data.
We intend to extend the new virtualization model's application to the safe administration of medical records in Nigerian healthcare facilities. The growing worldwide epidemic has made vulnerabilities easier for hackers to take advantage of and steal private medical data, making this expansion essential. Patient confidentiality is seriously threatened by the unapproved release of health information, sometimes known as "health information leakage”.
CONFLICT OF INTERESTS
None.
ACKNOWLEDGMENTS
We give the Most High God all the praise and thanks for giving us the life and wisdom that allowed us to finish this endeavor successfully. We would want to take this opportunity to sincerely thank everyone who helped make this initiative a success.
REFERENCES
Arthur (2006). Some Studies in Machine Learning Using the Game of Checkers. IBM Journal of Research and Development, 3(3), 210-229. https://doi.org/10.1147/rd.33.0210
Bengio, Y., Courville, A., & Vincent, P. (2013). Representation Learning: A Review and New Perspectives. IEEE Transactions on Pattern Analysis and Machine Intelligence, 35(8), 1798-1828. https://doi.org/10.1109/TPAMI.2013.50
Bengio, Y., LeCun, Y., & Hinton, G. (2015). Deep Learning. Nature, 521(7553), 436-444. https://doi.org/10.1038/nature14539
Berry (1997). Data Mining Techniques For Marketing, Sales and Customer Support. Wiley, 10.
Boyd, C. R., Tolson, M. A., & Copes, W. S. (1987). Evaluating Trauma Care: The TRISS Method. Trauma Score and the Injury Severity Score. The Journal of Trauma, 27(4), 370-378. https://doi.org/10.1097/00005373-198704000-00005
C, I., James, G. G., & F. U, O. (2020). A Neuro-Fuzzy Based Document Tracking & Classification System. International Journal of Engineering Applied Sciences and Technology, 4(10), 414-423. https://doi.org/10.33564/IJEAST.2020.v04i10.075
Chukwu, E. G., James, G. G, Benson-Emenike, M. E., & Michael, N. A. (2023). Observed and Evaluated Service Quality on Patients Waiting Time of University of UYO Teaching Hospital using Queuing Models. 8(5), 2094-2098.
Ciresan, D., Meier, U., & Schmidhuber, J. (2012). Multi-Column Deep Neural Networks for Image Classification. 2012 IEEE Conference on Computer Vision and Pattern Recognition. pp. 3642-3649. https://doi.org/10.1109/CVPR.2012.6248110
Commonwealth of Australia (2000). The Changing Nature of Fraud in Australia.
Cramer (2002). Evaluating Trauma Care: The TRISS Method. Trauma Score and the Injury Severity Score". The Journal of Trauma, 27(4), 370-378. https://doi.org/10.1097/00005373-198704000-00005
Ekong, A. P., James, G. G., & Ohaeri, I. (2024). Oil and Gas Pipeline Leakage Detection using IoT and Deep Learning Algorithm, 6(1). https://doi.org/10.51519/journalisi.v6i1.652
Ekong, A., James, G., Ekpe, G., Edet, A., & Dominic, E. (2024). A Model for the Classification of Bladder State Based on Bayesian Network, 5(2). https://doi.org/10.51519/journalisi.v5i4.629
Harnad (2008). The Annotation Game: On Turing (1950) on Computing, Machinery, and Intelligence", in Epstein, Robert; Peters, Grace (eds.), The Turing Test Sourcebook: Philosophical and Methodological Issues in the Quest for the Thinking Computer, Kluwer, 23-66. https://doi.org/10.1007/978-1-4020-6710-5_3
Ituma, C. I., Iwok, S. O., & James, G. G. (2020). Implementation of an Optimized Packet Switching Parameters in Wireless Communication Networks. International Journal of Scientific & Engineering Research, 11(1).
Ituma, C., James, G. G., & Onu, F. U. (2020). A Neuro-Fuzzy Based Document Tracking & Classification System. International Journal of Engineering Applied Sciences and Technology, 4(10), 414-423. https://doi.org/10.33564/IJEAST.2020.v04i10.075
Ituma, C., James, G. G., & Onu, F. U. (2020). Implementation of Intelligent Document Retrieval Model Using Neuro-Fuzzy Technology. International Journal of Engineering Applied Sciences and Technology, 4(10), 65-74. https://doi.org/10.33564/IJEAST.2020.v04i10.013
James, G. G., Okafor P. C., Chukwu E. G., Michael N. A., Ebong O. A. (2024). Predictions of Criminal Tendency Through Facial Expression Using Convolutional Neural Network. Journal of Information Systems and Informatics, 6(1). https://doi.org/10.51519/journalisi.v6i1.635
James, G. G., & Ben, Oto-Abasi M. (2012). Fuzzy Diagnostic Support System for Asthma. International Journal of Engineering and Technological Mathematics, 5(1&2), 8-13.
James, G. G., Asuquo, J. E., & Etim, E. O.
(2023). Adaptive Predictive Model for Post Covid'19
Health-Care Assistive Medication Adherence System. In Contemporary Discourse on
Nigeria's Economic Profile A FESTSCHRIFT in Honour of Prof. Nyaudoh Ukpabio
Ndaeyo on his 62nd Birthday (Vol. 1, pp. 622-631). University of Uyo, Nigeria.
James, G. G., Chukwu, E. G. & Ekwe, P. O.
(2023). Design of an Intelligent based System for
the Diagnosis of Lung Cancer. International Journal of Innovative Science and
Research Technology, 8(6), 791-796.
James, G. G., Ejaita, O. A., & Inam, I. A. (2016). Development of Water Billing System: A Case Study of Akwa Ibom State
Water Company Limited, Eket Branch. The International Journal of Science &
Technoledge, 4(7).
James, G. G., Ekanem, G. J., Okon, E. A., & Ben, O. M. (2012). The Design of e-Cash Transfer System for Modern Bank Using Generic Algorithm. International Journal of Science and Technology Research. International Journal of Science and Technology Research, 9(1).
James, G. G., Okpako, A. E., & Agwu, C. O. (2023). Tention to use IoT technology on agricultural processes in Nigeria based on modified UTAUT Model: Perpectives of Nigerians' farmers. Scientia Africana, 21(3), 199-214. https://doi.org/10.4314/sa.v21i3.16
James, G. G., Okpako, A. E., Ituma, C., & Asuquo, J. E. (2022). Development of Hybrid Intelligent based Information Retreival Technique. International Journal of Computer Applications, 184(34), 1-13. https://doi.org/10.5120/ijca2022922401
James, G. G., U., U. A., Umoeka, Ini J., U., Edward N.,
& Umoh, A. A. (2010). Pattern Recognition
System for the Diagnosis of Gonorrhea Disease. International Journal of
Development in Medical Sciences, 3(1&2), 63-77.
James, G. G., Ufford, O. U., Ben, O. M., & Udoudo,
J. J. (2011). Dynamic Path Planning Algorithm for
Human Resource Planning. International Journal of Engineering and Technological
Mathematics, 4(1&2), 44-53.
James, G. G., Umoh, U. A., Inyang, U. G., & Ben, O. M. (2012). File Allocation in a Distributed Processing Environment using Gabriel's Allocation Models. International Journal of Engineering and Technical Mathematics, 5(1&2).
James, G., Anietie, E., Abraham, E., Oduobuk, E., Okafor, P. (2024). Analysis of Support Vector Machine and Random Forest Models for Predicting the scalability of a broadband network. Journal of the Nigerian Society of Physical Sciences, 2093-2093. https://doi.org/10.46481/jnsps.2024.2093
James, G., Ekong, A., & Odikwa, H. (2024). Intelligent Model for the Early Detection of Breast Cancer Using Fine Needle Aspiration of Breast Mass. International Journal of Research and Innovation in Applied Science, IX(III), 348-359. https://doi.org/10.51584/IJRIAS.2024.90332
James, G., Umoren, I., Ekong, A., Inyang, S. & Aloysius, O. (2024). Analysis of Support Vector Machine and Random Forest Models for Classification of the Impact of Technostress in Covid and Post-Covid Era. Journal of the Nigerian Society of Physical Sciences, 2102-2102. https://doi.org/10.46481/jnsps.2024.2102
James, G.G., Archibong, M.N., Onuodu, F.E., Abraham, E.E., & Okafor, P.C. (2024). Development of the Internet of Robotic Things for Smart and Sustainable Health Care. ShodhAI: Journal of Artificial Intelligence, 1(1), 9-27-9-27.
James, G.G., Okpako, A.E., & Ndunagu, J.N. (2017). Fuzzy Cluster Means Algorithm for the diagnosis of Confusable Disease, 23(1).
James, V. O., G. G., Asuquo, J. E., & Etim, V. O.
(2023). Combating Cybercrime in Nigeria: A Tool For
Economic Development. In Contemporary Discourse on Nigeria's Economic Profile A
FESTSCHRIFT in Honour of Prof. Nyaudoh U. Ndaeyo (Vol. 1, 478-485). University
of Uyo, Nigeria.
Krizhevsky, A., Sutskever, I., & Hinton, G. (2012). Image Net Classification with Deep Convolutional Neural Networks (PDF). NIPS 2012: Neural Information Processing Systems, Lake Tahoe, Nevada.
Marblestone, A. H., Wayne, G., & Kording, K. P. (2016). Toward an Integration of Deep Learning and Neuroscience. Frontiers in Computational Neuroscience, 10, 94. https://doi.org/10.3389/fncom.2016.00094
Melaboratorll and Grance (2009). Effectively and Securely using the Cloud Computing Paradigm (NIST Information Technology.
Okafor, P. C., James G. G., Ituma C. (2024). Design of an Intelligent Radio Frequency Identification (RFID) Based Cashless Vending Machine for Sales of Drinks. British Journal of Computer, Networking and Information Technology 7(3), 36-57. https://doi.org/10.52589/BJCNITWMNI1D4O
Okafor, P. C., Ituma, C, & James, G. G. (2023). Implementation of a Radio Frequency Identification (RFID) Based Cashless Vending Machine. International Journal of Computer Applications Technology and Research, 12(8), 90-98. https://doi.org/10.7753/IJCATR1208.1013
Olshausen, B. A. (1996). Emergence of Simple-Cell Receptive Field Properties by Learning a Sparse Code for Natural Images. Nature, 381(6583), 607-609. https://doi.org/10.1038/381607a0
Onu, F. U., Osisikankwu P. U., Madubuike C. E. & James G. G. (2015). Impacts of Object Oriented Programming on Web Application Development. International Journal of Computer Applications Technology and Research, 4(9), 706-710. https://doi.org/10.7753/IJCATR0409.1011
Podgor, E.S. (1999). Criminal
Fraud 'in American University Law Review, 4.
Ratner, A., Bach, S., & Varma, P. (2019). Chris. "Weak Supervision: The New Programming Paradigm for
Machine Learning". Hazyresearch.github.io. referencing work by many other
members of Hazy Research.
Rebovich, D.J., & Kane, J.L. (2002). An Eye for an Eye in the Electronic Age: Gauging Public Attitude Toward White Collar Crime and Punishment' in Journal of Economic Crime Management, 1(2), Fall.
Roschke (2009). Intrusion Detection Cloud Computing, in Dependable, Automatic, and Secure Computing. https://doi.org/10.1109/DASC.2009.94
Schmidhuber, J. (2015). Deep Learning in Neural Networks: An Overview". Neural Networks, 61, 85-117. https://doi.org/10.1016/j.neunet.2014.09.003
Schulz, H., & Behnke, S. (2012). Deep Learning. KI - Künstliche Intelligenz, 26(4), 357-363. https://doi.org/10.1007/s13218-012-0198-z
Tolles, J., & Meurer, W. J. (2016). Logistic Regression Relating Patient Characteristics to Outcomes. https://doi.org/10.1001/jama.2016.7653
Umoh, U. A., Umoh, A. A., James, G. G., Oton, U. U. &
Udoudo, J. J. (2012). Design of Pattern Recognition
System for the Diagnosis of Gonorrhea Disease. International Journal of
Scientific & Technology Research (IJSTR) 1 (5), 74-79.
Vishal (2018). Rule-Based and Game-Theoretic Approach to Online Credit Card Fraud Detection.
|
|
 This work is licensed under a: Creative Commons Attribution 4.0 International License
© ShodhAI 2024. All Rights Reserved.